 GF Pipings Systems Valve
集团成立于1802年,由GF管路系统、GF楼宇方案、GF成型方案和GF加工方案四个事业部组成,总部位于瑞士。截至2023年底,在45个国家设有187家公司,其中76家为制造型公司,并拥有105个生产基地。在2023年,GF分布于全球的19,824名员工,共计创造了40.26亿瑞士法郎的销售额。
集团成立于1802年,由GF管路系统、GF楼宇方案、GF成型方案和GF加工方案四个事业部组成,总部位于瑞士。截至2023年底,在45个国家设有187家公司,其中76家为制造型公司,并拥有105个生产基地。在2023年,GF分布于全球的19,824名员工,共计创造了40.26亿瑞士法郎的销售额。
| CHF million | 2023 | 2022 | 2023² |
|---|---|---|---|
| Order intake | 3'938 | 4'227 | 3'771 |
| Orders on hand | 827 | 931 | 779 |
| Sales | 4'026 | 3'998 | 3'861 |
| Sales growth % | 0.7 | 7.4 | -3.4 |
| Organic growth % | 3.7 | 13.5 | 3.7 |
| EBITDA (comparable)¹ | 511 | 507 | 492 |
| EBITDA margin (comparable)¹ % | 12.7 | 12.7 | 12.8 |
| EBITDA | 486 | 507 | 492 |
| EBITDA margin % | 12.1 | 12.7 | 12.8 |
| EBIT (comparable)¹ | 389 | 391 | 378 |
| EBIT margin (comparable)¹ % | 9.7 | 9.8 | 9.8 |
| EBIT | 365 | 391 | 378 |
| EBIT margin % | 9.1 | 9.8 | 9.8 |
| Net profit shareholders GF | 235 | 276 | |
| Free cash flow before acquisitions/divestments |
134 | 146 | |
| Invested capital (IC) | 1'707 | 1'277 | 1'342 |
| Return on invested capital (ROIC) (comparable)¹ % | 21.5 | 23.4 | 23.8 |
| Return on invested capital (ROIC) % | 19.8 | 23.4 | 23.8 |
| Number of employees | 19'824 | 15'207 | 16'137 |
¹Without PPA effects on inventory and items affecting comparability out of the Uponor acquisition.
²GF Corporation excl. positions & effects of Uponor, for comparative purpose only.
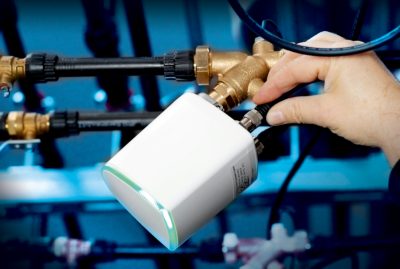
GF管路系统是全球领先的液体运输解决方案提供商,致力于以安全而可持续的方式运输液体,搭建生活”动脉“。该事业部专注于系统化解决方案,以及适用于多样化的安装基座的优质塑料和金属部件。配件、阀门、管道的产品组合、自动化和连接技术涵盖水循环应用的各个领域。
| CHF million | 2023 | 2022 |
|---|---|---|
| Order intake | 1'954 | 2'319 |
| Orders on hand at year end | 300 | 442 |
| Sales | 2'066 | 2'160 |
| Sales growth % | -4.4 | 9.6 |
| Organic growth % | 3.0 | 13.3 |
| EBITDA | 327 | 341 |
| EBITDA margin % | 15.8 | 15.8 |
| EBIT | 275 | 291 |
| EBIT margin % | 13.3 | 13.5 |
| Invested capital (IC) | 758 | 705 |
| Return on invested capital (ROIC) % | 31.1 | 35.6 |
| Number of employees | 8'798 | 8'085 |
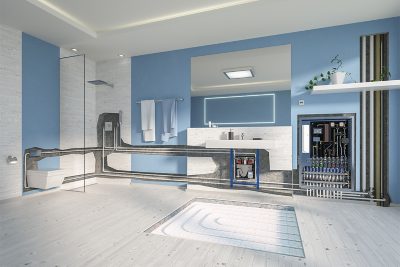
GF楼宇方案是全球领先的解决方案供应商,为城市、建筑物和家庭提供安全高效的水输送解决方案。该事业部提供安全的饮用水,节能的辐射供暖和制冷系统,以及可靠的基础设施解决方案,帮助住宅和商用建筑、市政以及公用事业领域的客户提高生产效率,并不断寻找可靠地节约、管理和输送水资源的新方法,释放水资源的潜力,为人们提供舒适、健康和高效能的生活。
| CHF million | 2023 |
|---|---|
| Order intake | 167 |
| Orders on hand at year-end | 47 |
| Sales | 164 |
| EBITDA (comparable)² | 19 |
| EBITDA margin (comparable)² % | 11.3 |
| EBITDA | -6 |
| EBITDA margin % | -3.7 |
| EBIT (comparable)² | 11 |
| EBIT margin (comparable)² % | 6.9 |
| EBIT | -13 |
| EBIT margin % | -8.2 |
| Invested capital (IC) | 365 |
| Number of employees | 3'687 |
¹GF Building Flow Solutions key figures only cover the months of November and December 2023.
²Without PPA effects on inventory and items affecting comparability out of the Uponor acquisition.
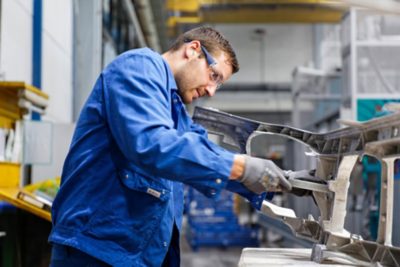
GF成型方案是交通和能源行业轻量化组件的领先解决方案提供商之一。作为一家面向未来的公司,我们努力推动铸造和增材制造领域的创新,并致力于在开发和制造创新节能的轻量化解决方案方面发挥带头作用。
| CHF million | 2023 | 2022 |
|---|---|---|
| Order intake | 912 | 965 |
| Orders on hand at year-end | 269 | 284 |
| Sales | 910 | 892 |
| Sales growth % | 2.0 | 1.4 |
| Organic growth % | 11.4 | 17.2 |
| EBITDA | 104 | 99 |
| EBITDA margin % | 11.4 | 11.1 |
| EBIT | 64 | 55 |
| EBIT margin % | 7.0 | 6.2 |
| Invested capital (IC) | 315 | 326 |
| Return on invested capital (ROIC) % | 17.6 | 11.2 |
| Number of employees | 3'792 | 3'570 |
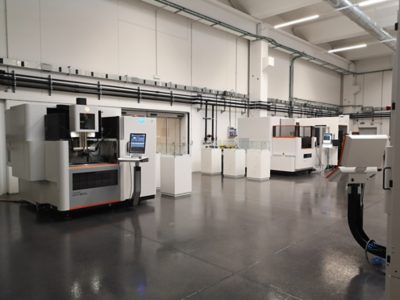
GF加工方案是世界领先的,为工具和模具制造行业及精密零件加工提供完整解决方案的的供应商之一。产品包括铣削和 EDM 机。该事业部还提供主轴、激光纹理、激光微加工、增材制造、自动化和工具,以及数字化解决方案。
| CHF million | 2023 | 2022 |
|---|---|---|
| Order intake | 907 | 945 |
| Orders on hand at year end | 211 | 206 |
| Sales | 887 | 948 |
| Sales growth % | -6.5 | 8.7 |
| Organic growth % | -1.9 | 10.9 |
| EBITDA | 75 | 81 |
| EBITDA margin % | 8.4 | 8.6 |
| EBIT | 60 | 67 |
| EBIT margin % | 6.8 | 7.0 |
| Invested capital (IC) | 267 | 196 |
| Return on invested capital (ROIC) % | 22.9 | 31.7 |
| Number of employees | 3'377 | 3'398 |